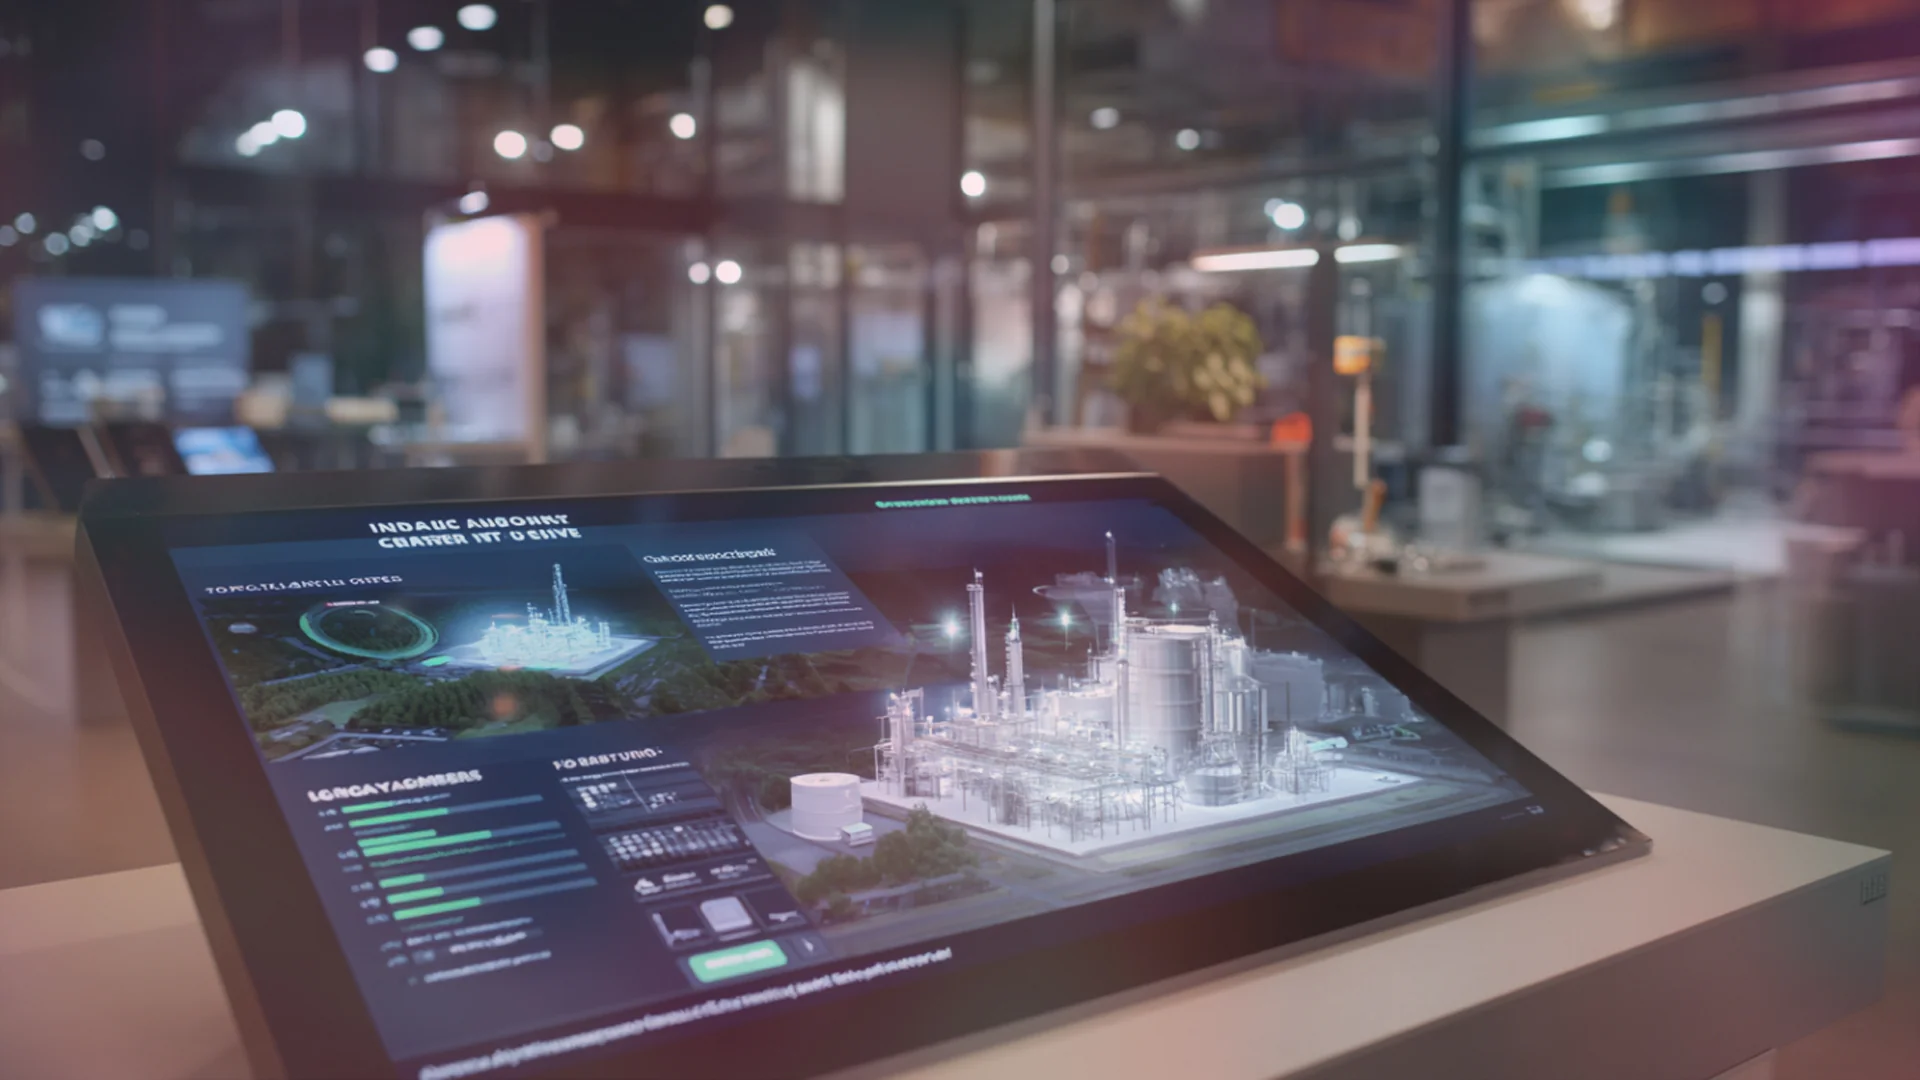
In a world where data is growing at an unstoppable rate, transforming information into understandable and memorable visual experiences has become essential. In this context, the interactive infographic has become one of the most powerful tools for simplifying complexity. They don't just present figures or processes: they invite the user to explore, discover, and participate , turning every piece of data into a visual story that informs, engages, and facilitates learning. From virtual recreations of factory , 3D maps, navigable digital spaces , to immersive simulations and Virtual Twins Representing real machinery, processes, and environments, interactive infographics enable users to understand large volumes of information, improve content retention, and make strategic decisions in real time. Their ability to combine narrative, design, and technology makes them an indispensable tool for companies that need to communicate critical information clearly and effectively. In this article, you will discover What is an interactive infographic, why it works, the different types of interactive infographics, and how to implement them in your company. , relying on real examples Imascono's innovations are transforming the way data is communicated, taught, and analyzed in sectors such as industry, health, tourism, and education.
What are Interactive Infographics?
The interactive infographics are advanced digital tools that enable complex information to be transformed into dynamic, explorable, and fully customizable visual experiences. Unlike traditional static infographics, a interactive infographic It integrates elements such as free navigation, content layers, 3D animations, interactive points, and real-time data, allowing users to understand a space, process, or system intuitively and deeply. At Imascono, many of these infographics are evolving toward Virtual Twins , three-dimensional virtual worlds that offer a large-scale view of a space, infrastructure, or production process. These digital twins act as interactive maps that guide users through points of interest explained in a visual, accessible, and narrative way. In addition, they can connect with IoT sensors and cloud platforms to display live data, taking the informational experience beyond static images. You may be interested in → What is a virtual space and how to use it
The interactive infographics stand out for their ability to make information clearer, more appealing, and more accessible. Here are some of their key features:
- Recreaciones virtuales en 3D Desde fábricas, aeropuertos y hospitales, hasta centros comerciales o cruceros, el usuario puede recorrer el espacio digital en 3D, explorando cada rincón y accediendo a información contextual en tiempo real mediante hotspots interactivos.
- Visualización clara de procesos complejos Gracias a su naturaleza visual y estructurada, las infografías interactivas convierten datos técnicos, operaciones industriales o flujos de trabajo en narrativas fáciles de comprender, reduciendo la curva de aprendizaje y mejorando la retención de información.
- Visitas remotas e intuitivas El usuario puede navegar el espacio desde cualquier dispositivo, como si estuviera físicamente allí. Esto permite realizar visitas técnicas, recorridos comerciales o explicativas sin necesidad de desplazamiento, combinando exploración, información y descubrimiento.
- Dynamic information management Una interactive infographic puede actualizar sus datos en tiempo real gracias a la integración con plataformas CMS y APIs. Esto convierte el contenido en una experiencia viva, evolutiva y siempre alineada con los últimos cambios de la organización.
- El espacio como guía inteligente Mediante mapas interactivos, geolocalización y rutas personalizadas, el entorno digital actúa como una guía inteligente que adapta el recorrido según las necesidades del usuario, facilitando el acceso a la información más relevante.
- Simulaciones y formaciones inmersivas Procesos de fabricación, flujos operativos o servicios complejos pueden mostrarse de forma visual e interactiva. Esto facilita la formación de empleados, la comunicación interna y la explicación técnica a clientes, inversores o visitantes.
Why are infographics effective in simplifying complex data?
Las Interactive infographics son una herramienta poderosa para simplificar datos complejos y transformar grandes volúmenes de información en experiencias visuales claras y comprensibles. Gracias al diseño, la narrativa y la interacción, permiten que los usuarios procesen la información de forma intuitiva, comprendan los conceptos clave y recuerden mejor los mensajes, convirtiendo lo técnico en algo accesible y atractivo. Además, al fomentar la participación activa del usuario, mejoran la retención del conocimiento y la toma de decisiones informadas. Esto permite que, en múltiples entornos, los procesos de análisis sean más ágiles, la interpretación sea más precisa y las decisiones estratégicas puedan basarse en datos actualizados en tiempo real. En definitiva, simplifican para potenciar el entendimiento y la acción, convirtiéndose en una herramienta imprescindible para organizaciones que manejan información crítica. Los Virtual Twins, la evolución más avanzada de las infografías interactivas, llevan esta capacidad al siguiente nivel aplicándose a sectores clave como turismo, industria y salud.
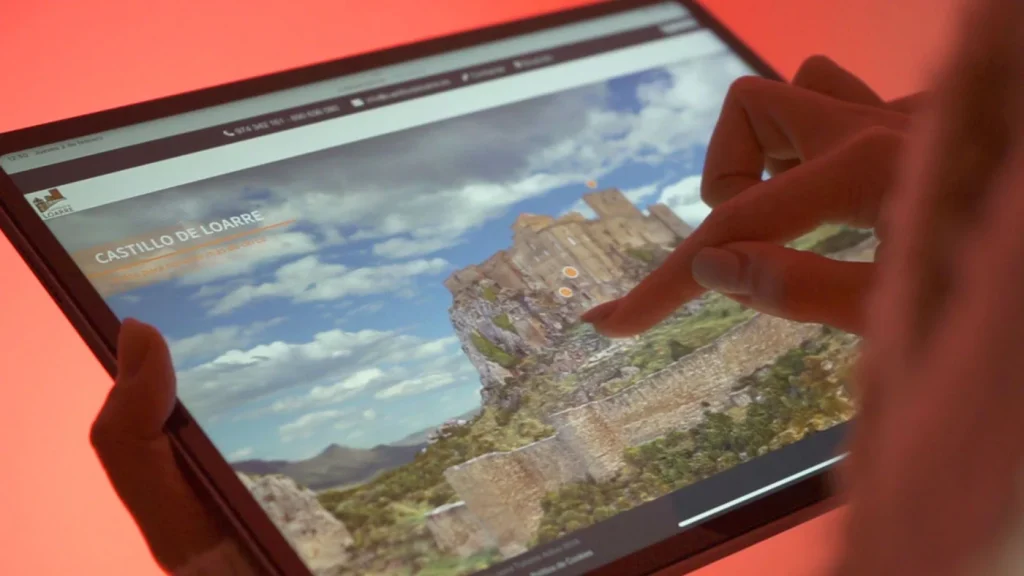
- En Tourism, permiten explorar destinos, monumentos y espacios culturales en 3D, como ocurre en proyectos como Setas de Sevilla or Loarre XR, facilitando visitas inmersivas antes, durante y después del viaje.
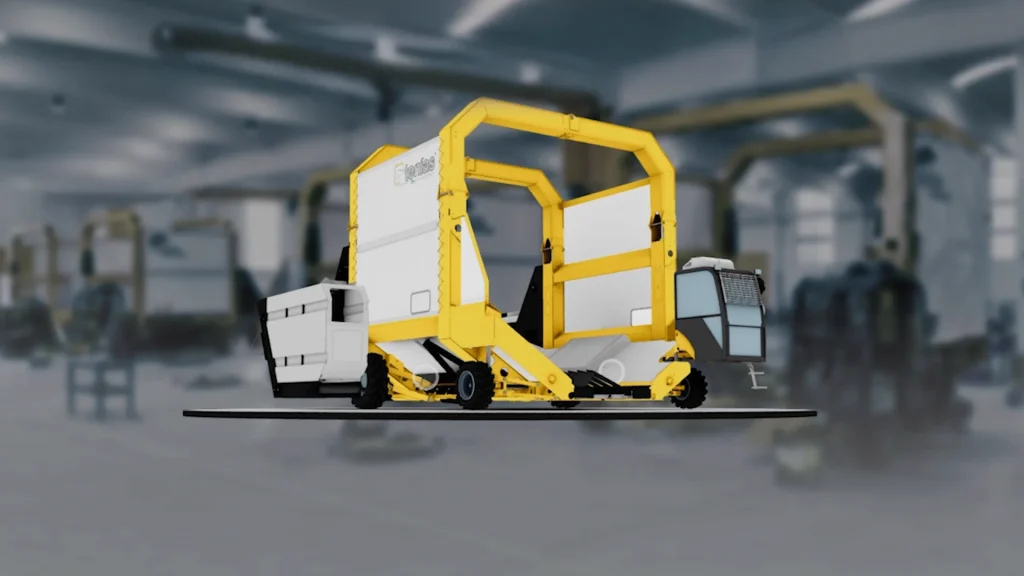
- En el ámbito industrial, ayudan a visualizar plantas, maquinaria y procesos productivos —como en Grupo Tenias, Certest or OVO Xtractor— ofreciendo formación, control y comunicación técnica sin necesidad de estar físicamente allí.
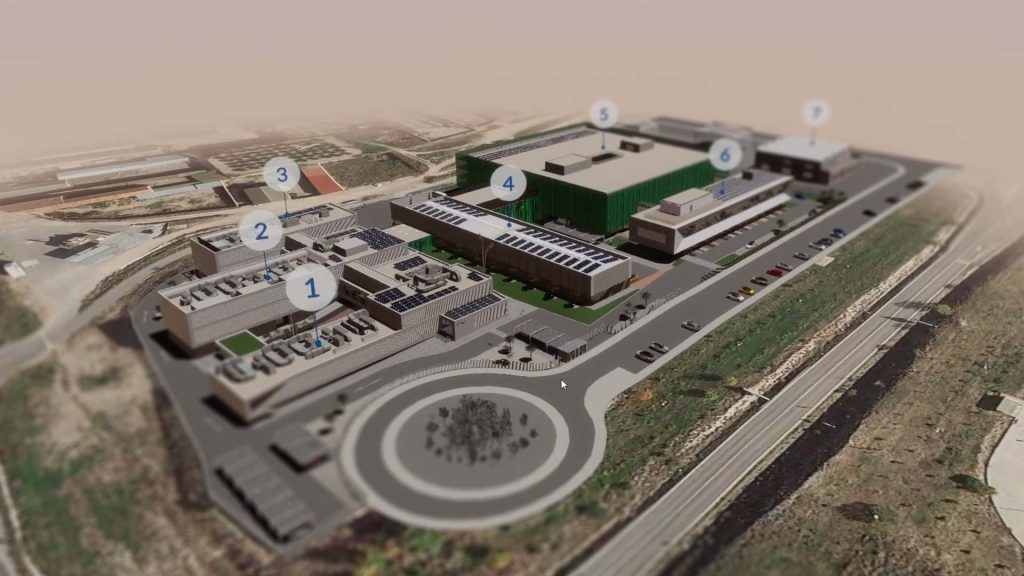
- Por último, en Healthcare, los Virtual Twins permiten explicar procedimientos médicos, analizar infraestructuras hospitalarias – como Valdebebas Twin o mejorar la comunicación clínica, facilitando la comprensión tanto para profesionales como para pacientes.
In all cases, these experiences make complex matters accessible and empower decision-making based on accurate and visually intelligible information.
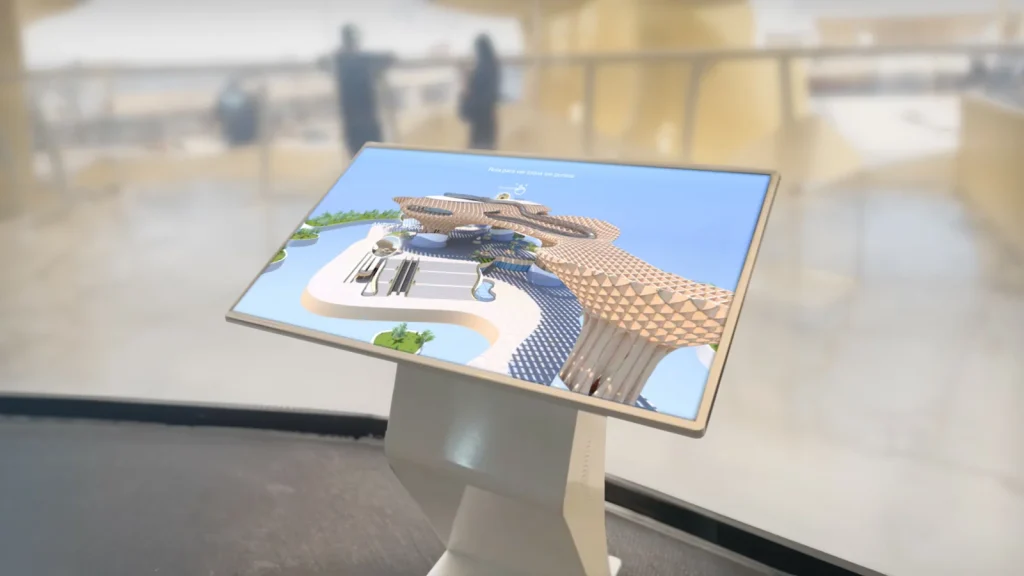
Different types of Virtual Twin usage
The interactive infographics in Extended Reality represent the natural evolution of the concept of data visualization. These experiences transform information into immersive three-dimensional environments , allowing users to navigate spaces, explore processes, and understand data from within. From recreating factories and monuments to digital campuses and training simulations, Virtual Twins adapt to the needs of sectors as diverse as tourism, industry, health, and biotechnology. Below, we present some use cases that demonstrate their versatility and value.
Ovo Xtractor
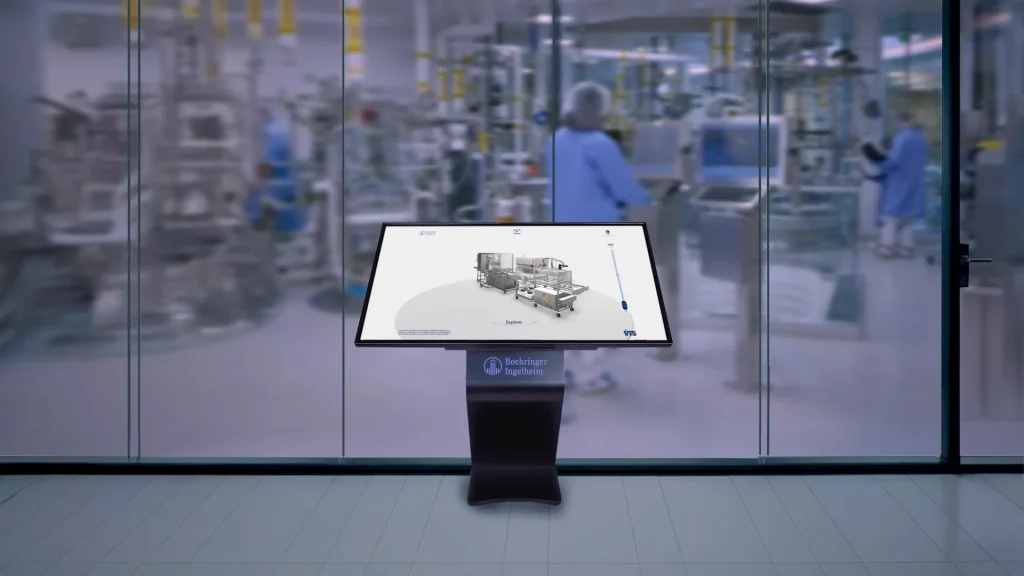
An example of innovation applied to the industrial and biotechnological fields. OVO Xtractor , developed for Boehringer Ingelheim, is an advanced training tool that transforms technical training into an immersive experience. Through an interactive 3D environment, users learn to manage complex industrial processes visually, safely, and intuitively. This Digital Twin improves understanding, reinforces knowledge retention, and increases operational safety for both operators and customers, becoming a key resource for industrial efficiency.
Certest
A corporate virtual space that connects innovation, science, and communication . The Certest Virtual Twin allows you to explore its facilities, production processes, and biotechnological solutions in an immersive way. Designed as an interactive 3D infographic, it offers a clear, attractive, and up-to-date view of its scientific activity, reinforcing brand identity and facilitating communication with customers, partners, and collaborators. A strategic tool for showcasing the value of research and infrastructure without the need for physical travel.
Loarre XR
An immersive journey into the past that blends heritage and technology . With Loarre XR , we recreate the iconic Loarre Castle in an interactive three-dimensional environment where users can explore its architecture, history, and natural surroundings as if they were there. This educational and cultural experience combines storytelling , Extended Reality, and gamification to rediscover heritage in an innovative and accessible way. An example of how Virtual Twins can revitalize cultural tourism and improve historical dissemination.
How Imascono can help you implement interactive infographics in your business strategy
Integrate a interactive infographic in business strategy represents a leap towards more intelligent visual communication, where data is no longer static but becomes dynamic, explorable, and memorable experiences . These solutions allow processes, products, and services to be displayed in an immersive way, facilitating understanding, sparking interest, and enhancing the emotional impact of the message. A clear example can be found in the Virtual Twin , an experience that combines 3D visualization, real-time data, and personalized interaction to present complex information in an intuitive way. These types of developments are examples of interactive infographics applied to the corporate environment: tools that not only inform, but also involve, educate, and convert , helping companies across all sectors communicate their unique value in innovative ways. Implementing interactive infographics involves rethinking how we communicate a brand's value proposition. From the team building the explanation of industrial processes or the presentation of technological solutions , until the sale of complex products or the dissemination of strategic projects , This type of resource opens the door to a new visual language that drives differentiation, improves efficiency, and facilitates a data-driven decision-making . If you want to take your data to the next level and transform information into interactive visual experiences that surprise and connect in Imascono We are ready to help you. Contact us at and discover how our Virtual Twins They can be integrated into your business strategy to enhance communication, improve training, and facilitate decisions in an innovative and effective way.