Interactive infographics: why they are effective for transforming complex data
In a world where data is growing at an unstoppable rate, transforming information into understandable and memorable visual experiences has become essential. In this context, the interactive infographic has become one of the most powerful tools for simplifying complexity. They don't just present figures or processes: they invite the user to explore, discover, and participate, turning every piece of data into a visual story that informs, engages, and facilitates learning.
From virtual recreations of factories, 3D maps, navigable digital spaces, to immersive simulations and Virtual Twins Representing real machinery, processes, and environments, interactive infographics enable users to understand large volumes of information, improve content retention, and make strategic decisions in real time. Their ability to combine narrative, design, and technology makes them an indispensable tool for companies that need to communicate critical information clearly and effectively.
In this article, you will discover What is an interactive infographic, why it works, the different types of interactive infographics, and how to implement them in your company., relying on real examples Imascono's innovations are transforming the way data is communicated, taught, and analyzed in sectors such as industry, health, tourism, and education.
What are Interactive Infographics?
The interactive infographics are advanced digital tools that enable complex information to be transformed into dynamic, explorable, and fully customizable visual experiences. Unlike traditional static infographics, a interactive infographic It integrates elements such as free navigation, content layers, 3D animations, interactive points, and real-time data, allowing users to understand a space, process, or system intuitively and deeply.
At Imascono, many of these infographics are evolving toward Virtual Twins, three-dimensional virtual worlds that offer a large-scale view of a space, infrastructure, or production process. These digital twins act as interactive maps that guide users through points of interest explained in a visual, accessible, and narrative way. In addition, they can connect with IoT sensors and cloud platforms to display live data, taking the informational experience beyond static images.
You may be interested in → What is a virtual space and how to use it
The interactive infographics stand out for their ability to make information clearer, more appealing, and more accessible. Here are some of their key features:
- Virtual 3D recreations
From factories, airports, and hospitals to shopping malls and cruise ships, users can navigate the digital space in 3D, exploring every corner and accessing contextual information in real time through interactive hotspots.
- Clear visualization of complex processes
Thanks to their visual and structured nature, interactive infographics convert technical data, industrial operations, or workflows into easy-to-understand narratives, reducing the learning curve and improving information retention.
- Remote and intuitive visits
Users can navigate the space from any device, as if they were physically there. This allows for technical visits, commercial tours, or explanatory tours without the need to travel, combining exploration, information, and discovery.
- Dynamic information management
A interactive infographic You can update your data in real time thanks to integration with CMS platforms and APIs. This turns content into a living, evolving experience that is always aligned with the latest changes in the organization.
- Space as an intelligent guide
Through interactive maps, geolocation, and personalized routes, the digital environment acts as a smart guide that adapts the route to the user's needs, facilitating access to the most relevant information.
- Simulations and immersive training
Manufacturing processes, operational flows, or complex services can be displayed visually and interactively. This facilitates employee training, internal communication, and technical explanations to customers, investors, or visitors.
Why are infographics effective in simplifying complex data?
The interactive infographics They are a powerful tool for simplifying complex data and transforming large volumes of information into clear and understandable visual experiences. Through design, narrative, and interaction, they allow users to process information intuitively, understand key concepts, and better remember messages, turning technical information into something accessible and engaging.
In addition, by encouraging active user participation, they improve the knowledge retention y la informed decision-making. This allows for more agile analysis processes, more accurate interpretation, and strategic decisions based on real-time data in multiple environments. In short, simplify to enhance understanding and action, becoming an essential tool for organizations that handle critical information.
The Virtual Twins, the most advanced evolution of interactive infographics, take this capability to the next level by applying it to key sectors such as tourism, industry, and health.
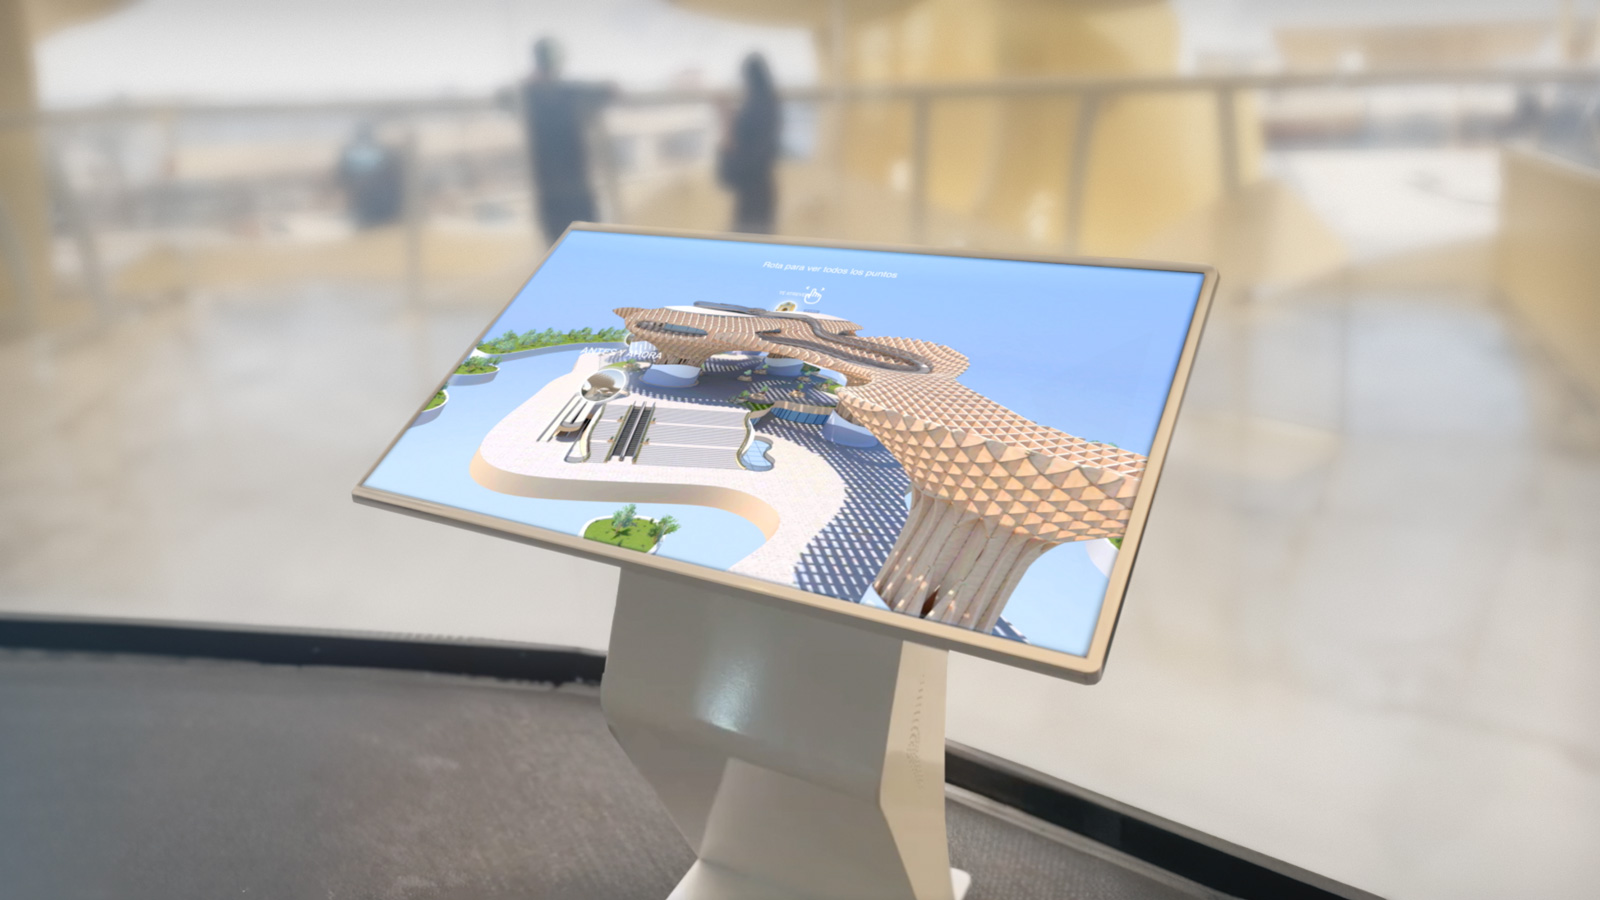
- At tourism, allow you to explore destinations, monuments, and cultural spaces in 3D, as in projects such as Mushrooms from Seville o Loarre XR, facilitating immersive visits before, during, and after the trip.
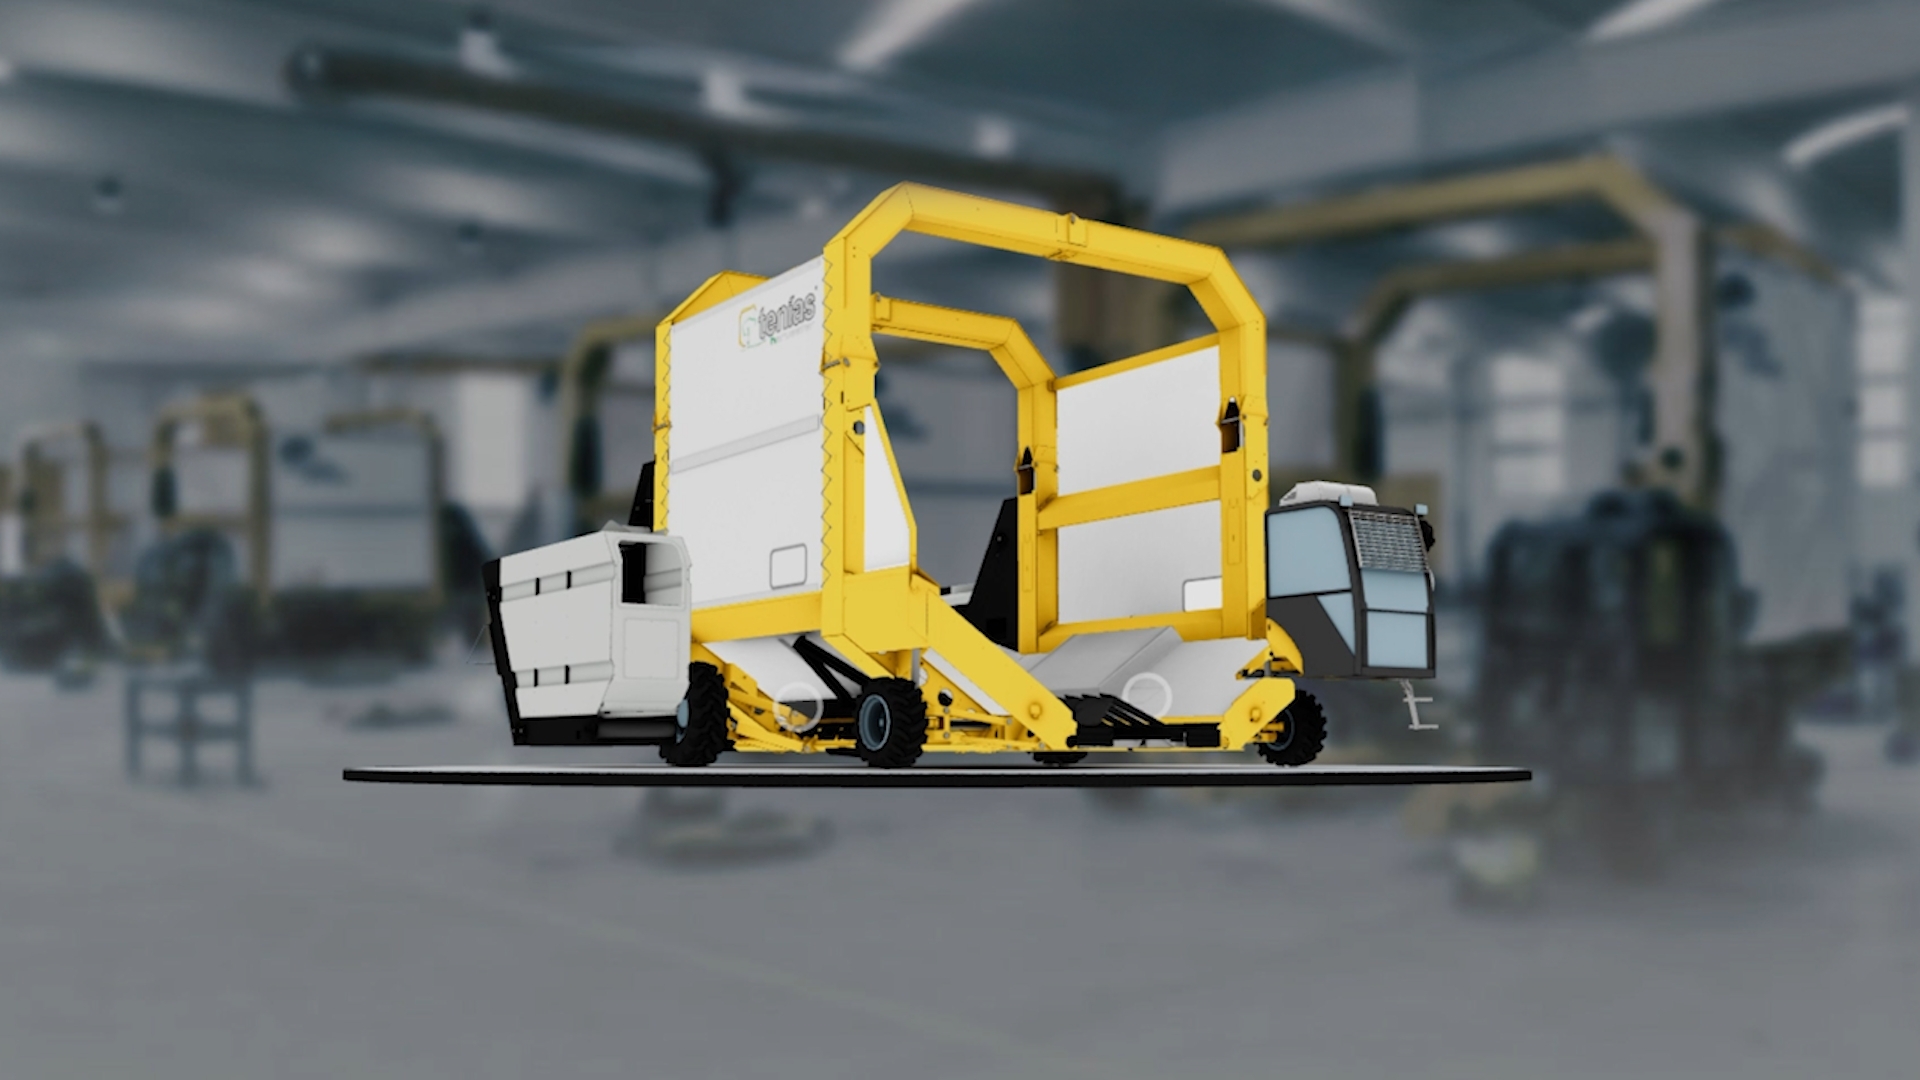
- In the field industrial, help visualize plants, machinery, and production processes—as in Tapeworm Group, Certest u OVO Xtractor— offering training, monitoring, and technical communication without needing to be physically present.
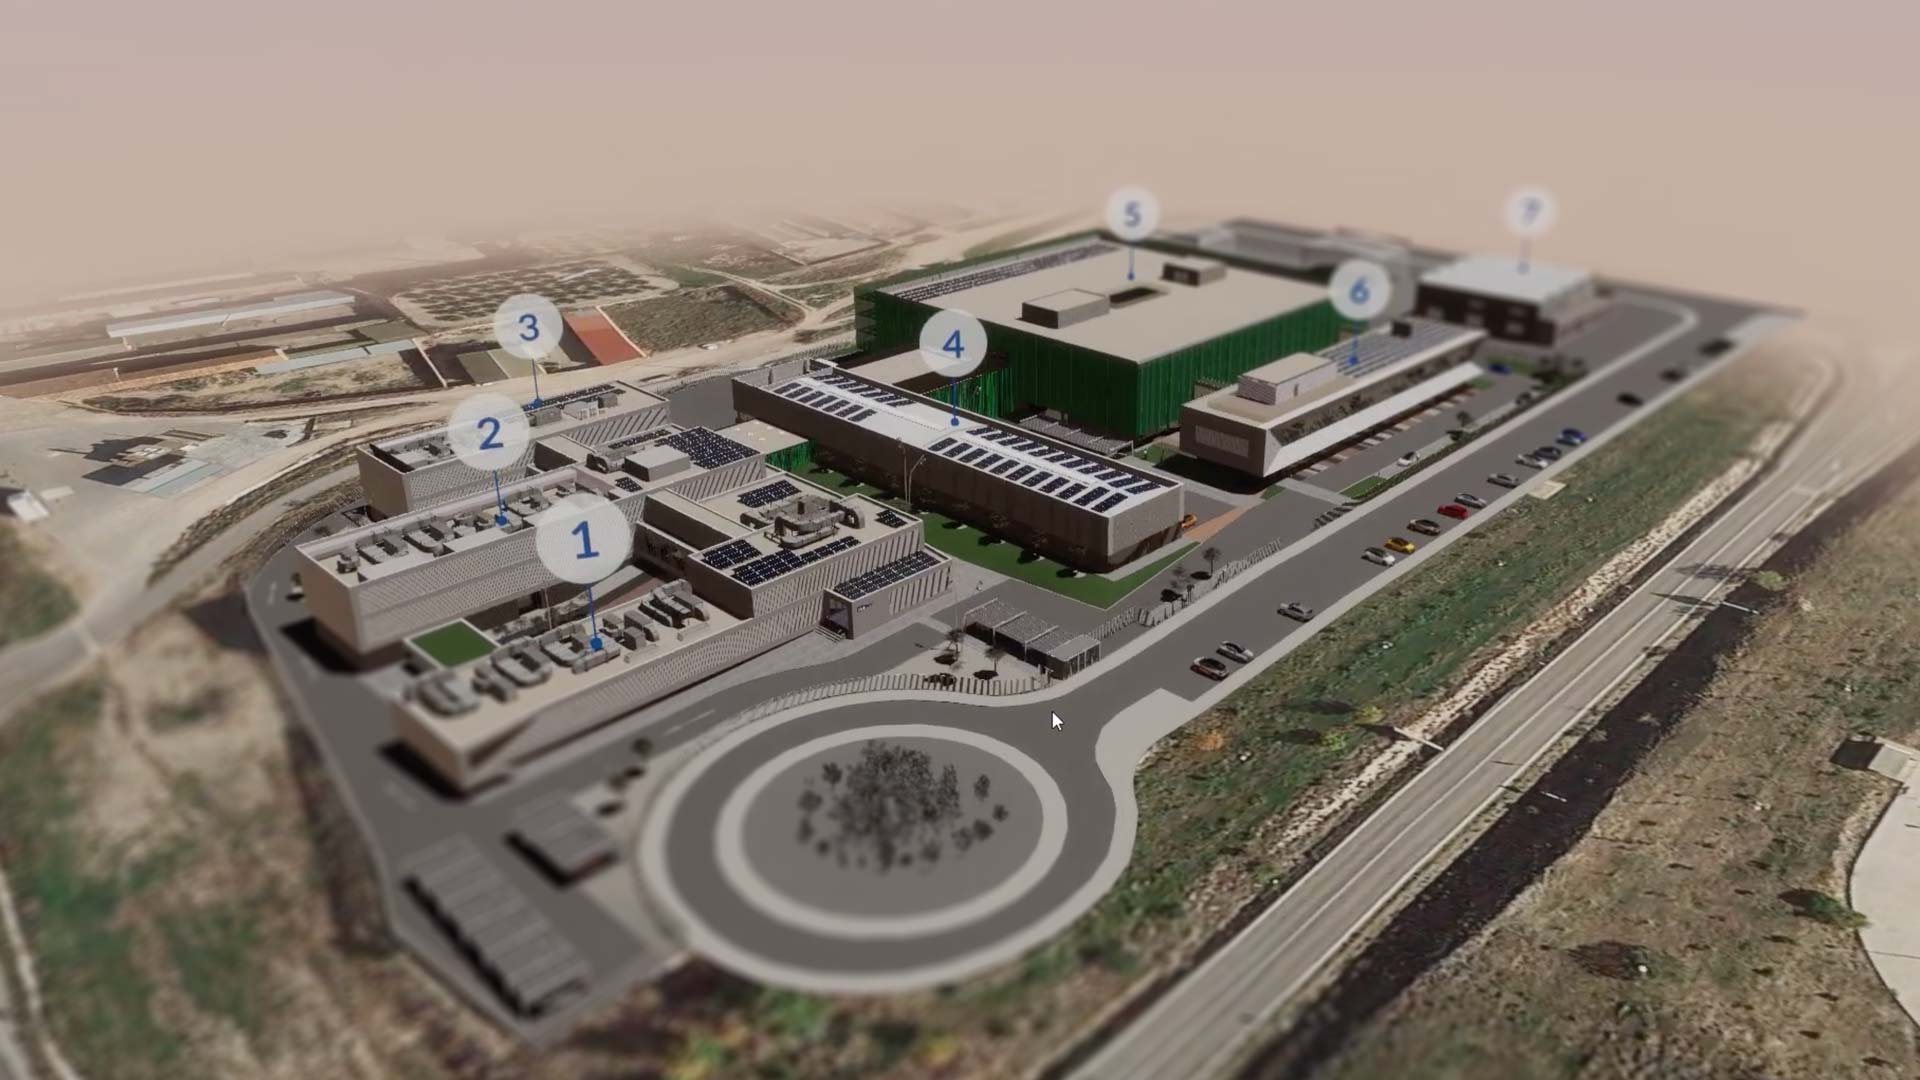
- Finally, in health, Virtual Twins make it possible to explain medical procedures and analyze hospital infrastructure, such as Valdebebas Twin or improve clinical communication, facilitating understanding for both professionals and patients.
In all cases, these experiences make complex matters accessible and empower decision-making based on accurate and visually intelligible information.
Different types of Virtual Twin usage
The interactive infographics in Extended Reality represent the natural evolution of the concept of data visualization. These experiences transform information into immersive three-dimensional environments, allowing users to navigate spaces, explore processes, and understand data from within. From recreating factories and monuments to digital campuses and training simulations, Virtual Twins adapt to the needs of sectors as diverse as tourism, industry, health, and biotechnology. Below, we present some use cases that demonstrate their versatility and value.
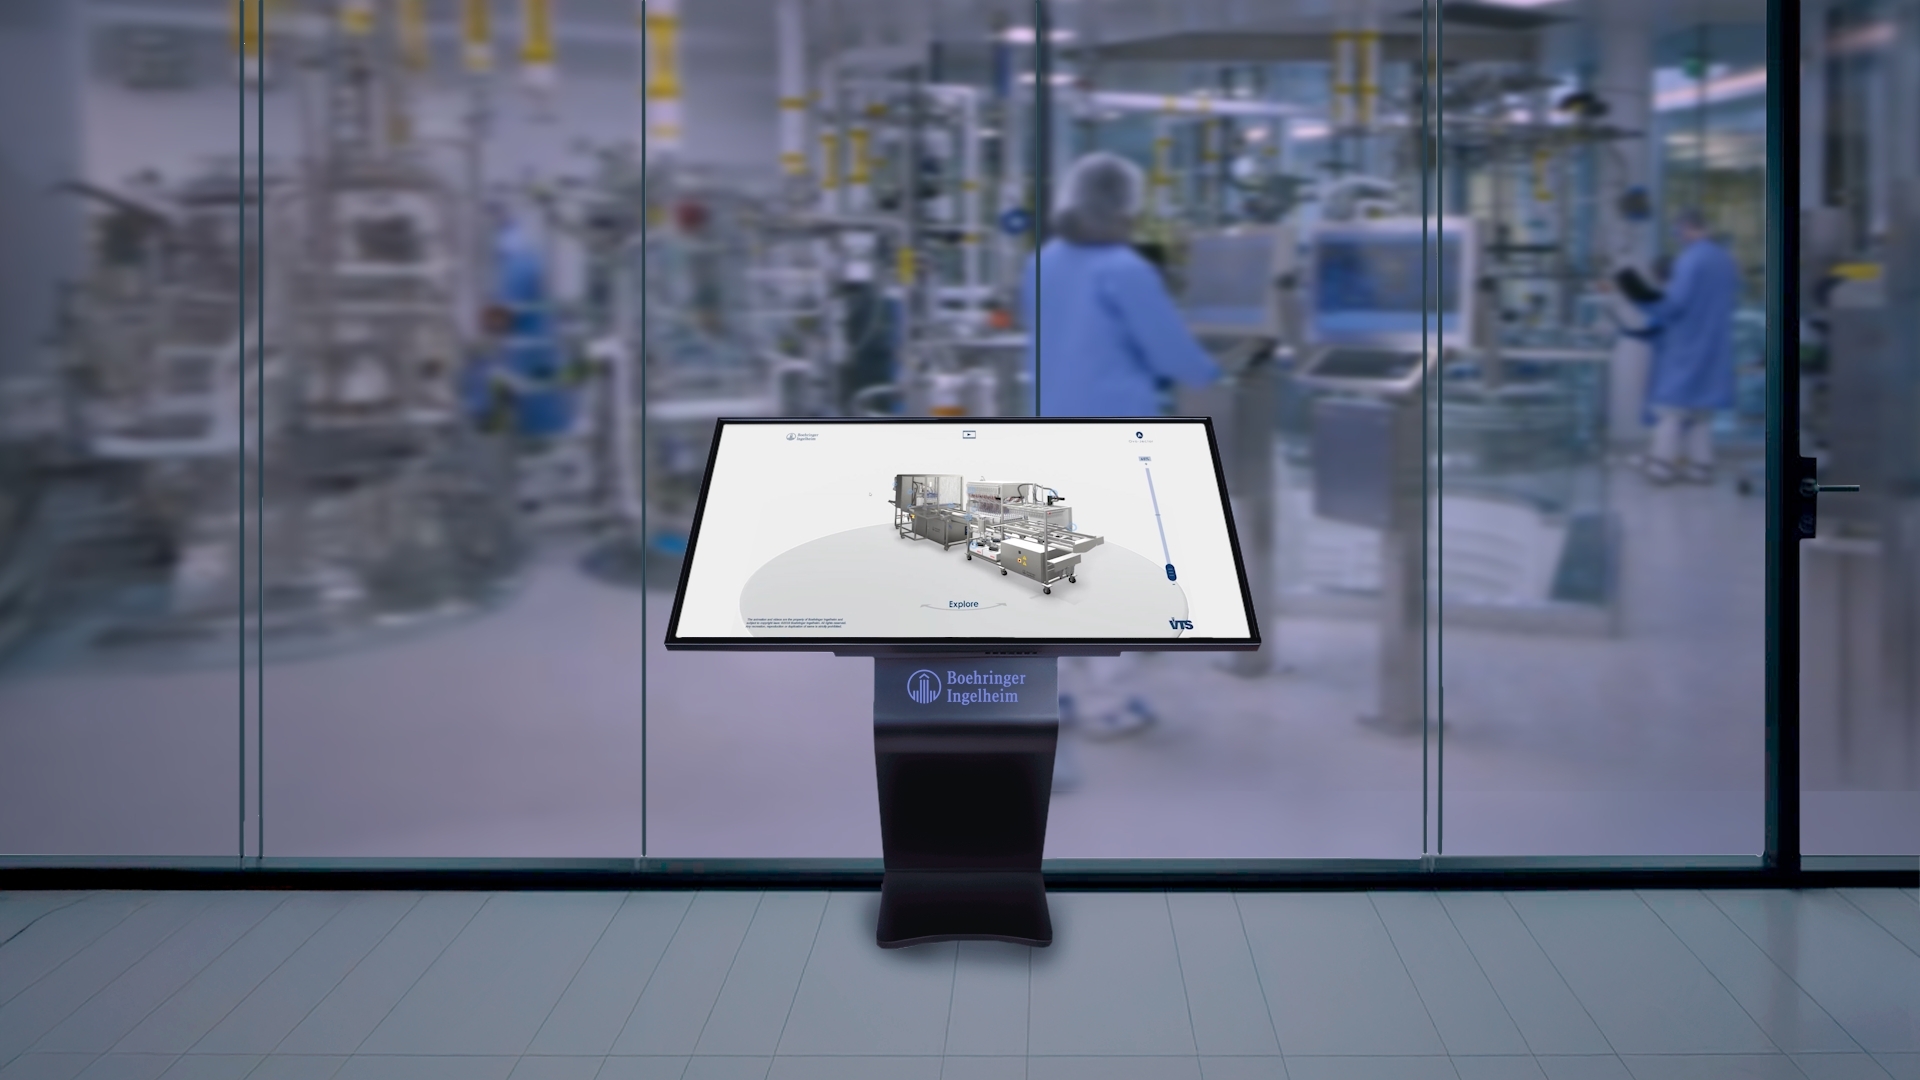
Ovo Xtractor
An example of innovation applied to the industrial and biotechnological fields. OVO Xtractor, developed for Boehringer Ingelheim, is an advanced training tool that transforms technical training into an immersive experience. Through an interactive 3D environment, users learn to manage complex industrial processes visually, safely, and intuitively. This Digital Twin improves understanding, reinforces knowledge retention, and increases operational safety for both operators and customers, becoming a key resource for industrial efficiency.
Certest
A corporate virtual space that connects innovation, science, and communication. The Certest Virtual Twin allows you to explore its facilities, production processes, and biotechnological solutions in an immersive way. Designed as an interactive 3D infographic, it offers a clear, attractive, and up-to-date view of its scientific activity, reinforcing brand identity and facilitating communication with customers, partners, and collaborators. A strategic tool for showcasing the value of research and infrastructure without the need for physical travel.
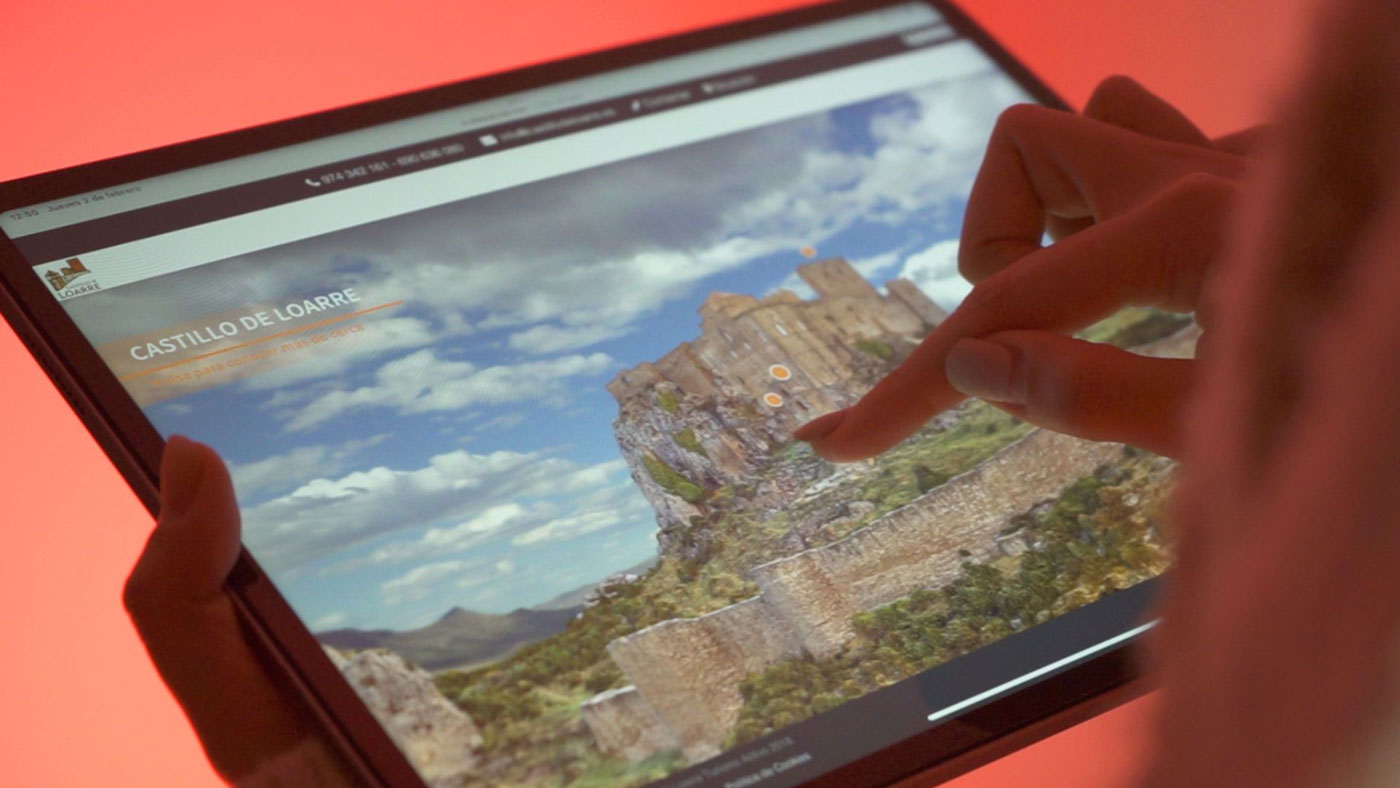
Loarre XR
An immersive journey into the past that blends heritage y technology. With Loarre XR, we recreate the iconic Loarre Castle in an interactive three-dimensional environment where users can explore its architecture, history, and natural surroundings as if they were there. This educational and cultural experience combines storytelling, Extended Reality, and gamification to rediscover heritage in an innovative and accessible way. An example of how Virtual Twins can revitalize cultural tourism and improve historical dissemination.
How Imascono can help you implement interactive infographics in your business strategy
Integrate a interactive infographic in business strategy represents a leap towards more intelligent visual communication, where data is no longer static but becomes dynamic, explorable, and memorable experiences. These solutions allow processes, products, and services to be displayed in an immersive way, facilitating understanding, sparking interest, and enhancing the emotional impact of the message.
A clear example can be found in the Virtual Twin, an experience that combines 3D visualization, real-time data, and personalized interaction to present complex information in an intuitive way. These types of developments are examples of interactive infographics applied to the corporate environment: tools that not only inform, but also involve, educate, and convert, helping companies across all sectors communicate their unique value in innovative ways.
Implementing interactive infographics involves rethinking how we communicate a brand's value proposition. From the team buildingthe explanation of industrial processes or the presentation of technological solutions, until the sale of complex products or the dissemination of strategic projects, This type of resource opens the door to a new visual language that drives differentiation, improves efficiency, and facilitates a data-driven decision-making.
If you want to take your data to the next level and transform information into interactive visual experiences that surprise and connectin Imascono We are ready to help you. Contact us at and discover how our Virtual Twins They can be integrated into your business strategy to enhance communication, improve training, and facilitate decisions in an innovative and effective way.